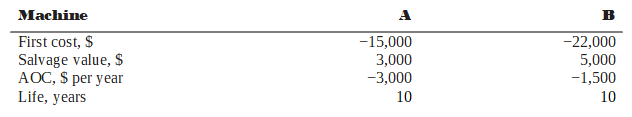
Select A or B under the following conditions using the method described or as instructed:
(a) Before-tax PW analysis using spreadsheet functions.
(b) After-tax PW analysis using classical SL depreciation over the 10-year life using hand solution.
(c) After-tax PW analysis using MACRS depreciation with a 5-year recovery period using a spreadsheet. Assume the machines will be retained for 10 years, then sold at the estimated salvage values.
(a) Function for PWA: = -PV(14%,10,-3000,3000) – 15000 displays PWA = $-29,839
Function for PWB: = -PV(14%,10,-1500,5000) – 22000 displays PWA = $-28,475
Select B with a slightly higher PW value.
(b) All AOC estimates generate tax savings; GI estimates are equal.
Machine A
Annual depreciation = (15,000 – 3,000)/10 = $1200
Tax savings = (AOC + D)(0.5) = 4200(0.5) = $2100
CFAT = -3000 + 2100 = $-900
PWA = -15,000 – 900(P/A,7%,10) + 3000(P/F,7%,10)
= -15,000 – 900(7.0236) + 3000(0.5083)
= $-19,796
Machine B
Annual depreciation = (22,000 – 5000)/10 = $1700
Tax savings = (1500 + 1700)(0.50) = $1600
CFAT = –1500 + 1600 = $100
PWB = –22,000 + 100(P/A,7%,10) + 5000(P/F,7%,10)
= –22,000 + 100(7.0236) + 5000(0.5083)
= $–18,756
Again, select B with a slightly higher PW value.
(c) Again, select machine B. All methods give the same conclusion
%20figure%203.png)
By hand, if needed:
MACRS with n = 5 and a DR in year 10, which is a tax, not a tax savings.
Tax savings = (AOC + D)(0.5), years 1-6
CFAT = -AOC + tax savings, years 1-10.
%20figure%203.png)
%20FIGURE%204.png)
%20ANSWER.png)